Follow Us

| Consolidated | The Company Only | |||||
|---|---|---|---|---|---|---|
| Unit : Million Baht | 2025 | 2024 | 2023 | 2025 | 2024 | 2023 |
| Total Assets | 154,131 | 123,097 | 108,145 | 145,845 | 113,669 | 98,709 |
| Total Liabilities | 57,404 | 43,155 | 40,606 | 42,929 | 33,418 | 31,853 |
| Paid-Up Capital | 1,247 | 1,247 | 1,247 | 1,247 | 1,247 | 1,247 |
| Total Shareholders' Equity | 96,727 | 79,942 | 67,539 | 98,16 | 80,251 | 66,856 |
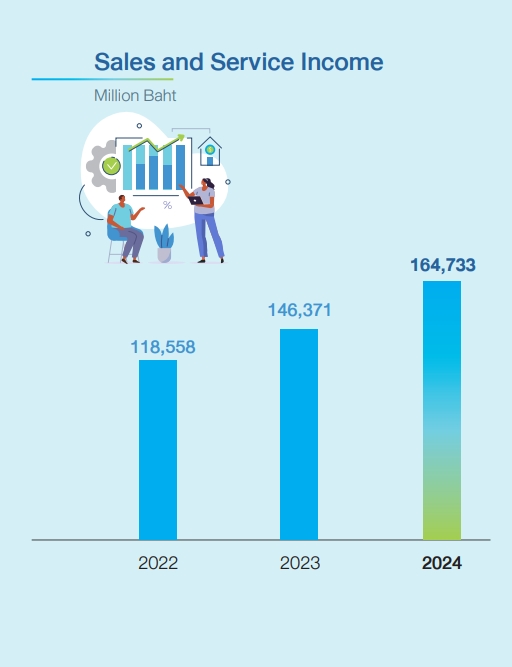
| Sales and Service Income | 198,154 | 164,733 | 146,371 | 174,405 | 138,985 | 124,996 |
| Others Revenues | 2,728 | 1,934 | 1,796 | 2,639 | 1,811 | 1,682 |
| Total Revenues | 200,883 | 166,737 | 148,167 | 177,044 | 140,882 | 126,678 |
| Cost of Sales | 144,547 | 124,236 | 112,881 | 124,442 | 101,102 | 94,607 |
| Gross Profit | 53,606 | 40,497 | 33,491 | 49,963 | 37,883 | 30,389 |
| Selling & Admin Expense | 27,280 | 22,637 | 15,483 | 24,276 | 20,249 | 13,545 |
| Operating Profit | 26,326 | 17,860 | 18,008 | 25,687 | 17,634 | 16,844 |
| Net Profit | 24,814 | 18,939 | 18,423 | 24,477 | 19,008 | 17,792 |
| Unit : (%) | ||||||
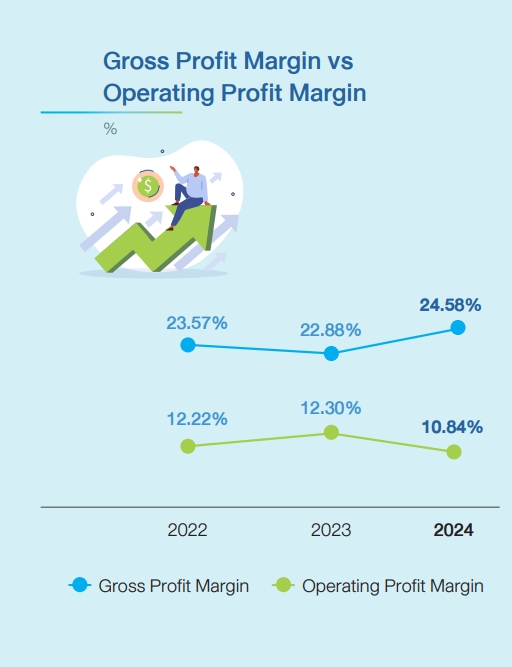
| Gross Profit Margin | 27.05% | 24.58% | 22.88% | 28.65% | 27.26% | 24.31% |
| Operating Profit Margin | 13.29% | 10.84% | 12.30% | 14.73% | 12.69% | 13.48% |
| Net Profit Per Total Revenues | 12.34% | 11.36% | 12.43% | 13.83% | 13.50% | 14.05% |
| Return On Equity | 28.09% | 25.68% | 30.15% | 27.32% | 25.84% | 29.38% |
| Return On Assets | 17.90% | 16.38% | 18.50% | 18.86% | 17.90% | 19.79% |
| Unit : Baht | ||||||
| Earning Per Share | 1.99 | 1.52 | 1.48 | 1.96 | 1.52 | 1.43 |
| Dividend Per Share | 0.60* | 0.46* | 0.45 | 0.60* | 0.46* | 0.45 |
| Book Value Per Share | 77.54 | 64.11 | 54.14 | 79.30 | 64.36 | 53.60 |
* Pending for approval from the 2026 annual shareholders’ meeting
Unit: THB Billion
| Year | Quarter | Sales Revenue | Gross Profit | Operating Profit | Net Profit |
|---|---|---|---|---|---|
| 2025 | Q1 | 42.7 | 10.9 | 5.7 | 5.5 |
| Q2 | 44.5 | 11.1 | 5.1 | 4.6 | |
| Q3 | 53.2 | 15.1 | 7.5 | 7.4 | |
| Q4 | 57.8 | 16.5 | 8.0 | 7.3 | |
| 2024 | Q1 | 38.0 | 8.0 | 3.7 | 4.3 |
| Q2 | 41.8 | 11.2 | 5.8 | 6.6 | |
| Q3 | 43.2 | 11.9 | 6.0 | 5.9 | |
| Q4 | 41.7 | 9.4 | 2.3 | 2.2 | |
| 2023 | Q1 | 32.3 | 6.7 | 3.5 | 3.6 |
| Q2 | 35.8 | 8.4 | 4.6 | 4.7 | |
| Q3 | 40.5 | 9.1 | 5.0 | 5.4 | |
| Q4 | 37.8 | 9.3 | 4.9 | 4.7 | |
| 2022 | Q1 | 24.6 | 5.1 | 2.2 | 2.8 |
| Q2 | 28.0 | 7.0 | 3.9 | 4.3 | |
| Q3 | 31.3 | 7.3 | 3.8 | 4.1 | |
| Q4 | 34.6 | 8.5 | 4.7 | 4.2 | |
| 2021 | Q1 | 19.0 | 4.1 | 1.4 | 1.8 |
| Q2 | 20.6 | 4.5 | 0.5 | 0.5 | |
| Q3 | 21.3 | 4.1 | 1.3 | 1.2 | |
| Q4 | 23.4 | 4.7 | 1.9 | 2.1 |
| Year | Revenue (THB Bn) |
GP Margin (%) |
OP Margin (%) |
NP Margin (%) |
EPS (THB per share) |
ROE (%) |
D/E ratio (Times) |
Quick ratio (Times) |
|---|---|---|---|---|---|---|---|---|
| 2025 | 198.2 | 27.1% | 13.3% | 12.5% | 1.99 | |||
| 2024 | 164.7 | 24.6 | 10.8% | 11.5% | 1.52 | 25.7% | 0.54 | 1.25 |
| 2023 | 146.4 | 22.9% | 12.3% | 12.6% | 1.48 | 30.2% | 0.6 | 1.13 |
| 2022 | 118.6 | 23.6% | 12.2% | 12.9% | 1.23 | 31.9% | 0.66 | 1.17 |
| 2021 | 84.3 | 20.6% | 7.0% | 7.9% | 0.54 | 17.0% | 0.67 | 1.11 |
| 2020 | 63.2 | 23.9% | 10.1% | 11.1% | 0.57 | 20.1% | 0.52 | 1.66 |
| 2019 | 51.2 | 20.5% | 4.5% | 5.8% | 0.24 | 8.9% | 0.39 | 2.04 |
| 2018 | 53.1 | 22.8% | 8.9% | 9.7% | 0.41 | 15.1% | 0.42 | 2.22 |
| 2017 | 49.3 | 25.5% | 11.3% | 10.0% | 0.40 | 15.2% | 0.42 | 2.37 |
| 2016 | 46.9 | 26.5% | 10.9% | 11.8% | 0.44 | 17.3% | 0.45 | 2.48 |
| 2015 | 46.9 | 27.3% | 13.2% | 14.3% | 0.54 | 22.0% | 22.0% | 2.71 |
| 2014 | 44.1 | 26.8% | 12.4% | 13.5% | 0.48 | 21.6% | 0.41 | 2.8 |
